If you’re biding your time, waiting for an opportune moment to make a property purchase in the USA, you will want to stay on top of how the market’s performing and where your money will go the furthest. Today we analyse the US homes market’s lively start to 2017.
Find homes in the USA via our property portal.
US sales at highest for ten years
Over the course of the first three months of 2017 the US property market has experienced its strongest quarterly sales growth for a decade. According to the data released by the National Association of Realtors (NAR) the speed with which property is selling is causing prices to rise across the nation.
The NAR report revealed that 17% of metro areas recorded double digit price increases between March 2016 and March 2017
The NAR’s latest index shows that property prices are up for the third consecutive quarter, which leaves the national median property price at $232,100 (£179,000), up 6.9% on where it was at this stage in 2016.
Lawrence Yun, Chief Economist at NAR, commented on what’s fuelling this increase in house prices: “Prospective buyers poured into the market to start the year, and while their increased presence led to a boost in sales, new listings failed to keep up and hovered around record lows all quarter…. Those able to successfully buy most likely had to outbid others, especially for those in the starter home market, which in turn quickened price growth.”
Yun highlighted that it’s the major metro areas with the most buoyant job markets that are experiencing the biggest surge in prices due to buyer demand and lack of supply. That isn’t all good, said Mr Yun: “This is why many of these areas, in particular several parts of the South and West, are seeing unhealthy price appreciation that far exceeds incomes.”
The NAR report revealed that 17% of metro areas recorded double digit price increases between March 2016 and March 2017. This continued on from similar rises in the autumn of 2016. The first quarter of 2017 also saw total sales of existing homes (as opposed to new build or off-plan) increase by 1.4%.

San Jose: America’s most expensive suburb
In case you worry that there won’t be any property left to buy, there are currently around 1.83 million existing homes for sale across the USA. Plenty of choice then, even if this does amount to a 6.6% decrease in the number of available homes to buy, compared to last year.
Moving into summer, Mr Yun predicts that the high demand will continue. What is needed to cool down the price growth is a significant rise in the amount of property available – and this takes time. Great news if you’re selling, but not so great if you’re buying.
California leads on prices
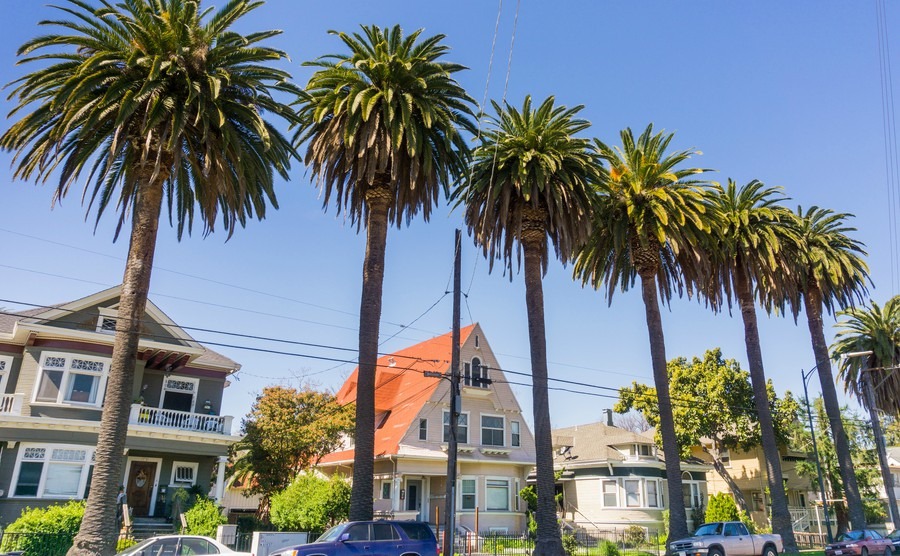
Of the five most expensive places to live in the USA according to median price in Q1 of 2017, four were in California:
1 – San Jose, California – $1,070,000 (£822,000)
2 – San Francisco, California – $815,000 (£626,000)
3 – Anaheim – Santa Ana, California – $750,000 (£576,000)
4 – Honolulu, Hawaii $746,000 (£573,000)
5 – San Diego, California $564,000 (£433,000)
Cash buyers dominate US market
According to a recent report published by information provider CoreLogic, cash sales accounted for 36.5% of total US property purchases during January 2017.
Although this figure has remained stable in the past year, it is far higher than it was in the years before the housing crisis, when cash purchases accounted for just 25%. The cash-buying peak was January 2011, when nearly half of US home sales were cash transactions.
The number of REO transactions has declined since its peak back in January 2011
Real-estate owned (REO) property, owned by a lender (usually by a bank) accounted for 61.2 % of these cash sales. Although high, again, the number of REO transactions has declined since its peak back in January 2011. REO sales made up 5.9% of distressed sales (where the owner is default on the mortgage) and 1.1% of short sales – which is where the proceeds of selling the property are less than the debts secured against it. Resales accounted for 36.5%, and new-builds for 17.7%.
Across all but eight of the US states, distressed sales were down in January 2017 when compared with 2016. The total distressed sales share of 7% was slightly below where it stood in 2016. This is the lowest distressed sales share since September 2007.

Download your free USA property guide
Our guide to buying a house in America is readily available online, but you can also a PDF version to view when you're offline or print. Simply fill in the form to the right and you'll be able to download your free copy.
- Ask the right questions
- Avoid the legal pitfalls
- Find your property
- Avoid losing money
- Move in successfully


