
The UK isn’t short of data on the property market. Indeed it might be a case of TMI – too much information – when you consider that at least ten different organisations produce house price indexes. But two official stats are a good place to start when collecting data for UK property investment.
Too much data might seem like a nice problem to have. But when it comes to investment decisions, “confirmation bias” can be a problem. You want to buy a property in Brighton, for example, so you just keep on looking until you find the one piece of data that supports your non-scientific preference. (And that’s before we get on to “courtesy bias”, “gambler’s fallacy”, “hyperbolic discounting” and any of the other dozens of ways that buyers can end up with a rotten deal!).

Pretty in pink, but will these Chelsea homes leave your investments in the red or black?
So where can you cut the c**p and get to the heart of the matter. One way, at least in the UK where accurate records are kept, is to look at the data from the UK’s official (although independent) national statisticians – the ONS.
ONSHPI: the “official” house price index
The UK government’s Office for National Statistics House Price Index (ONSHPI) is widely recorded as highly accurate, if not as timely as some other indexes. It uses data gathered by HM Land Registry, on both cash and mortgage transactions. The drawback is that the time between the completed transaction can be over two months. So it is already almost a season behind, whereas an index of agreed prices can be almost immediate.
However, it does cover a huge number of transactions and divides into small geographical areas. Indeed, some of the areas are so tight that the data samples are a little too small. It also beaks this down into property type, buyer status and how it is being funded.
If you’re buying from abroad, currency movements mean the price you pay for UK property will be changing by the minute. Protect your budget from currency risk when buying in the UK. Read the Property Buyer’s Guide to Currency.
It is presented as a changes in prices as an index by the month and year, as well as a cash average property price. The data is released monthly, on the second or third Wednesday of each month. It is always two months behind, with May 2018 data coming out on 18 July. The data is very easy to understand, and can be downloaded in a variety of formats. This includes a graph (see below) showing annual prices changes in the different parts of the UK.
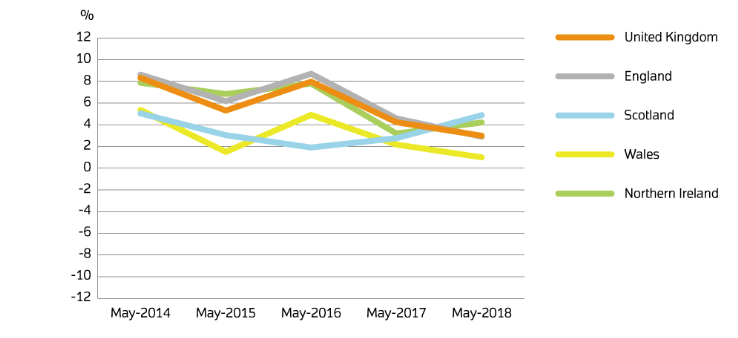
Annual price change for UK by country over the past 5 years
In depth data
But this can be broken down much further and into different numbers. The graph below shows average house prices in pounds for the English regions. No surprise, perhaps that London has vastly outpaced the rest of the UK. But note that it began to stretch its lead at exactly the same time as London enjoyed a hugely successful Olympics in 2012. As memories fade and international focus turns to cities like Paris in 2024, will London prices fall?
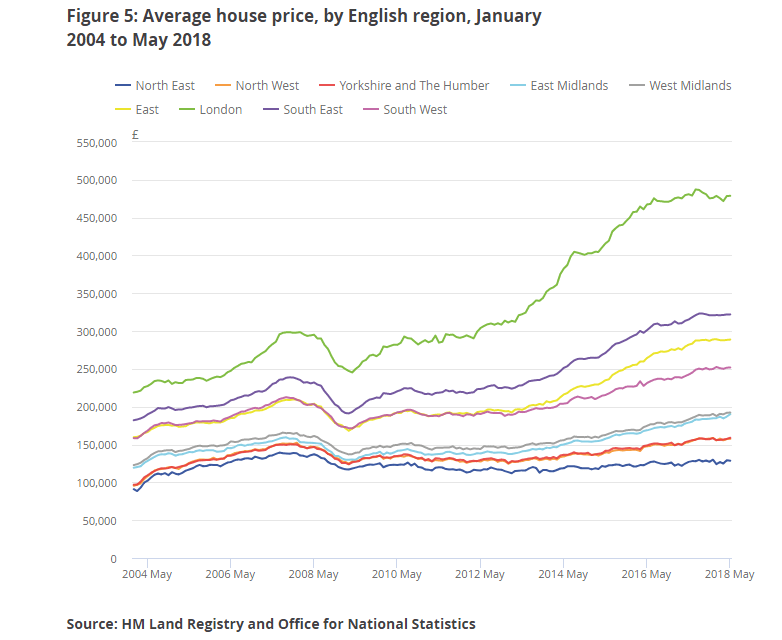
Average house price, by English region, January 2004 to May 2018 (source, ONS)
There is fascinating and useful data for UK property investors on the performance of different types of British property too. All of it is available to download in a variety of different formats. Below, for example, is the average price year on year for houses and flats. This shows how, with Britain’s property now at a price that makes it available only to older people, so demand for family housing has pushed up the price. Could the heavy emphasis on getting as many homes onto each plot – especially in London – be creating a glut of flats?
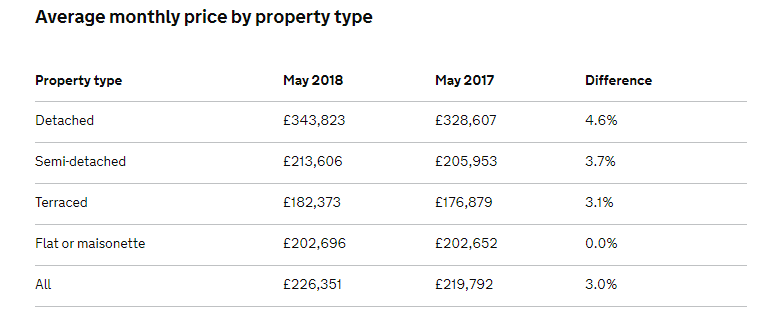
Average monthly price by property type
Transaction Volumes
Another of the most useful house price stats is also the simplest – transaction volumes. These record the number of property sales over a period. Although the basic data comes out with the ONSHPI, for more indepth information read HM Revenue and Custom’s (HMRC) UK Property Transaction Statistics.
It shows both homes and commercial property transactions, seasonally adjusted. You can see over the UK as a whole or divided into England, Wales, Scotland and Northern Ireland.
The stats are used by the government to look for trends in the British property market, but are just as useful for investors too. The graph below records the total number of UK property transactions per month between April 2005 and April 2018. You will see straight away the effect that a government policy can have, as the huge spike in sales in March 2016 was investors’ rush to beat additional stamp duty on investment property. Note that sales in the UK have fallen from between 120,000 and 150,000 to well under 120,000 per month since the financial crisis. Yet there are more people and more homes in the UK than ever before. Investors might want to ask why people aren’t buying or selling.
As you gather data you will greatly improve your negotiating position. Read our guide: How to Negotiate Abroad, for advice on calculating a fair price.
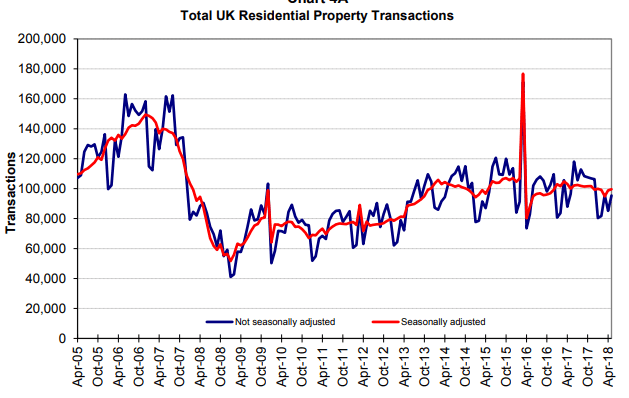
Total UK Residential Property Transactions per month
These two measures are only the beginning of any property investor’s analysis. Continue to read the UK Property Guide and we will bring you more valuable data for UK property investors.


